
In this tip of the month, we will see how construct a 3D drift from a center line. This will allow you to plan drift development and calculate the total volume and tonnage of the extracted ore. To do so:
- Go to the Drift Design Module Options and configure the gradual slope change parameters.
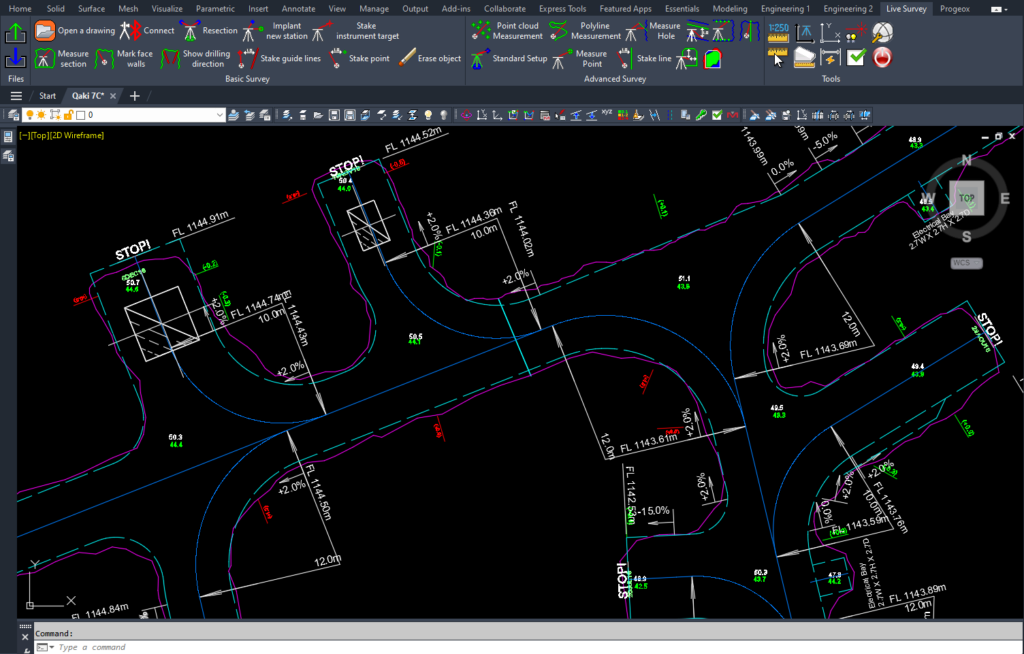
- Select the command “Draw Center Line” (PLDT) and start drawing a center line from scratch or from a previously drawn center line.
- In the window, select a direction and configure the other parameters: Start elevation, Slope, and Radius. Toggle the options “Draw walls” to insert the 2D walls, which follow the path of the centerline.
- Click OK and draw the centerline. Once finished, hit Enter, enter a value for the gradual slope change in the window and click OK.
- To edit the centerline, select the command “Edit Elevations” (PLED). In addition to editing the parameters of the center line, you may also link center lines by elevations, enter an advance rate and a start date as well.
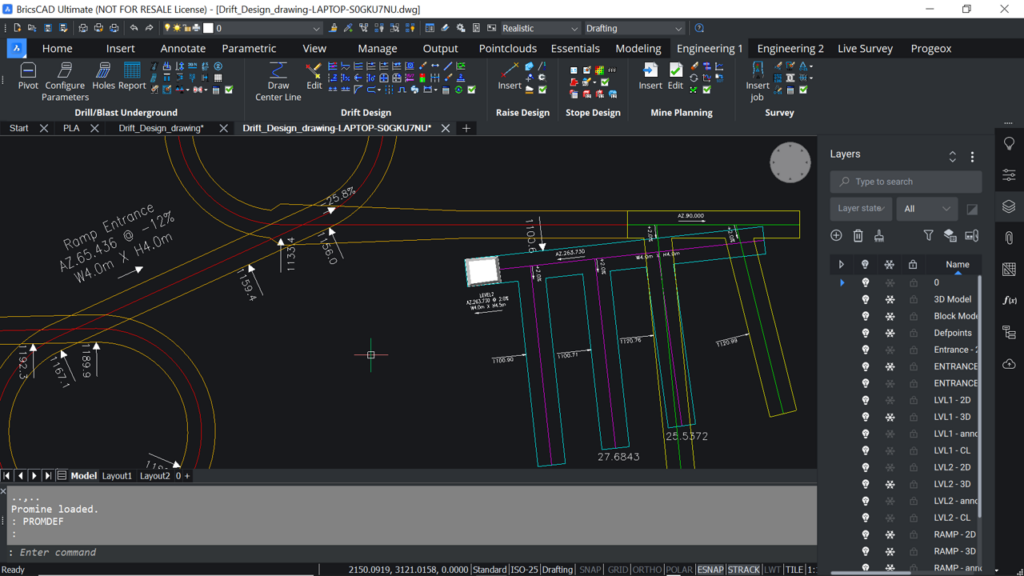
- Once the center line has been configured, select the command “Construct 3D Model” (PL3D) to start constructing the 3D drift.
- In the window, configure the shape of the drift then select the target layer. Select the option “Use the match with the centerline” to assign the drift the same layer as the center line.
- If the advance rate and start date of the centerline is configured, select the options “Divide the model per month” and “Use month colors” to color code the 3D drift based on months.
- Once the 3D drifts options are configured, click OK and the 3D model of the drift will be constructed.
- To insert a legend for the months colors, go to the Essentials Category -> Promine Tools -> Insert Legend -> select the option “Color by time periods” -> Choose the desired months and enter a scale -> Select the options “Text in color” and “Insert solid”. Click OK and insert the legend.
- Now, you can view which parts of the drifts will be constructed in which months, depending on the advance rate and start date of each center line.