

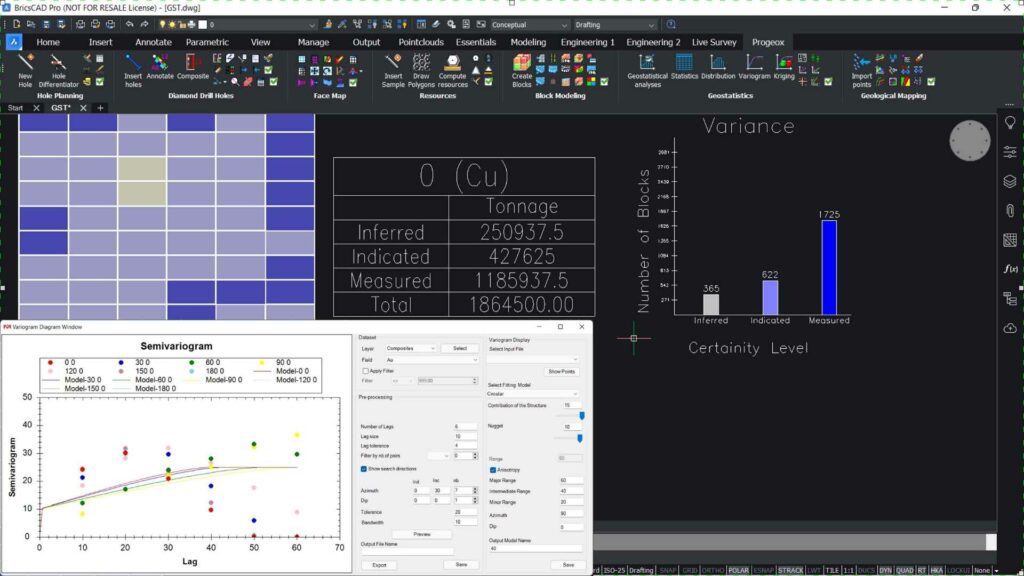
Geostatistics
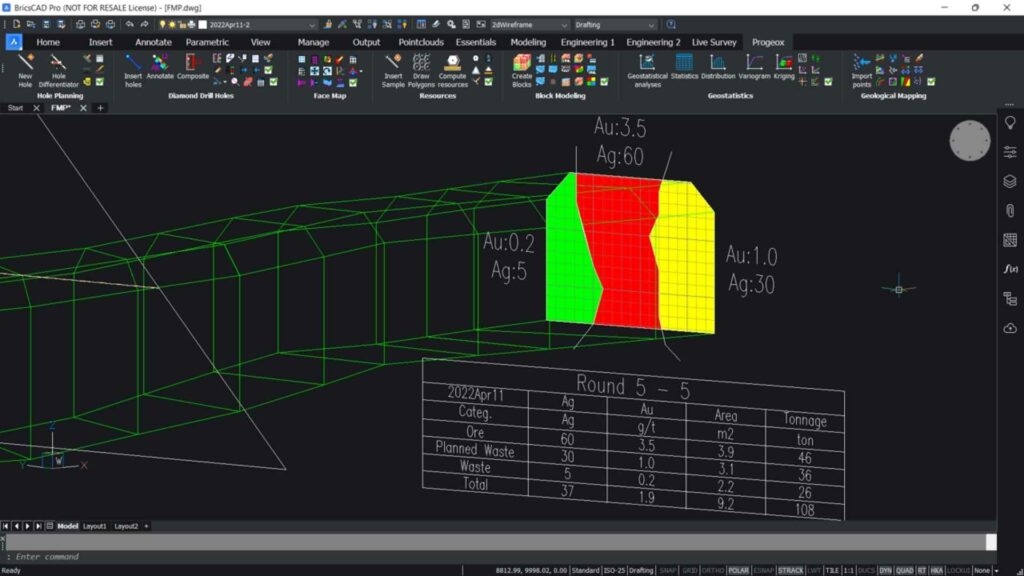
Calculate the statistics such as the median, coefficient of variation, percentile, etc. Insert a distribution table directly in the drawing, create a grade-tonnage curve and measure the correlation between different data.


For exploration & geology.
Compatible with ![]()


Compatible with ![]()